The dashboard provides different metrics based on the user’s role, with managers having access to more comprehensive data.
Filtering and Dynamic User Behavior
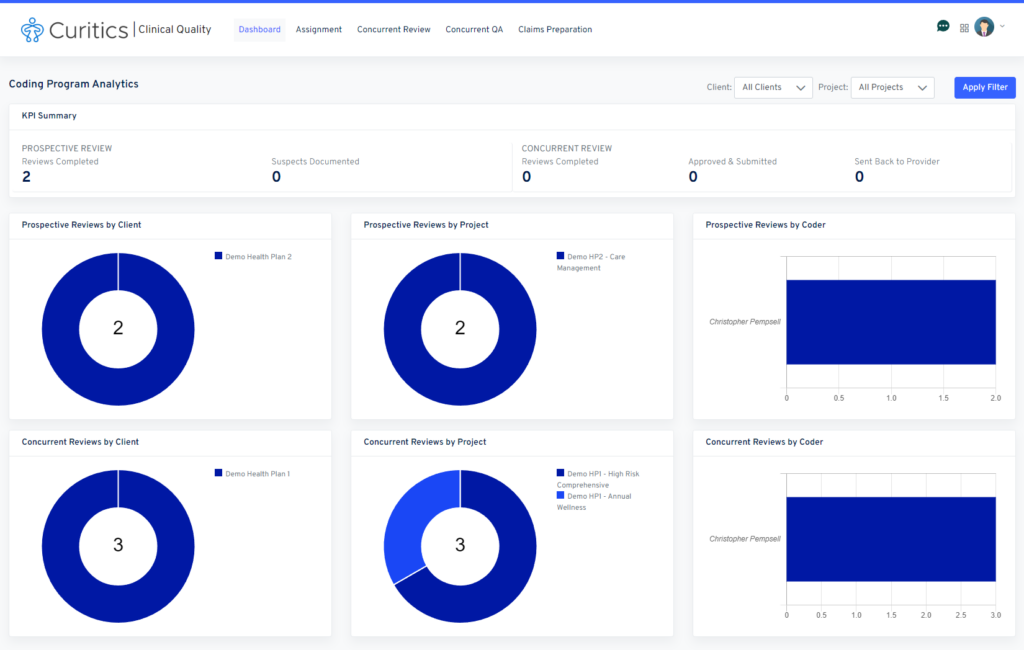
The clinical quality dashboard will provide three filters
- Filter by client
- Defaulted to all clients
- Filter by project
- Defaulted to all projects
- Filter by data range
- Defaulted to current year through now
If the user accessing the clinical quality dashboard is a manager (is_manager permission), the user will see data populated for all users of the provider module. If the user is not a manager, data will populate only for themselves.
The dashboard should only populated data for the clients and projects in which the user has been assigned.
Definitions and Summary of Metrics
| Section | Metric | Definition | Dynamic based upon is_manager permission |
| Coder Summary | Prospective Reviews Completed | Count of prospective reviews which have been completed | If non manager, metric shows only reviews associated to the user |
| Coder Summary | Prospective Suspects Documented | Count of suspect codes which were added via prospective reviews | If non manager, metric shows only reviews associated to the user |
| Coder Summary | Concurrent Reviews Completed | Count of concurrent reviews which have been completed | If non manager, metric shows only reviews associated to the user |
| Coder Summary | Concurrent Reviews Submitted | Count of concurrent reviews where the coder accepted and submitted the encounter | If non manager, metric shows only reviews associated to the user |
| Coder Summary | Concurrent Reviews Returned to Provider | Count of concurrent revews which resulted in the coder sending the encounter back to the provider | If non manager, metric shows only reviews associated to the user |
| Coder Summary | Retrospecive Reviews Completed | Count of retrospective reviews which have been completed | If non manager, metric shows only reviews associated to the user |
| Coder Summary | Retrospective Codes for Resubmisson | Count of codes which have been added for supplemental submission via retroreview | If non manager, metric shows only reviews associated to the user |
| Prospective Reviews by Client | Visualization | Doughnut chart visualization showing a count of revews by client for clients in which the coder is assigned. | If non manager, metric shows only reviews associated to the user |
| Prospective Reviews by Project | Visualization | Doughnut chart visualization showing a count of revews by project for projects in which the coder is assigned. | If non manager, metric shows only reviews associated to the user |
| Prospective Reviews by Provider | Visualization | Bar chart visualizations which shows a count revews by coder which apply to members which have project assignments which match that of the coder. | If non manager, metric shows only reviews associated to the user |
| Concurrent Reviews by Client | Visualization | Doughnut chart visualization showing a count of revews by client for clients in which the coder is assigned. | If non manager, metric shows only reviews associated to the user |
| Concurrent Reviews by Project | Visualization | Doughnut chart visualization showing a count of revews by project for projects in which the coder is assigned. | If non manager, metric shows only reviews associated to the user |
| Concurrent Reviews by Provider | Visualization | Bar chart visualizations which shows a count revews by coder which apply to members which have project assignments which match that of the coder. | If non manager, metric shows only reviews associated to the user |
| Retro Reviews by Client | Visualization | Doughnut chart visualization showing a count of revews by client for clients in which the coder is assigned. | If non manager, metric shows only reviews associated to the user |
| Retro Reviews by Project | Visualization | Doughnut chart visualization showing a count of revews by project for projects in which the coder is assigned. | If non manager, metric shows only reviews associated to the user |
| Retro Reviews by Provider | Visualization | Bar chart visualizations which shows a count revews by coder which apply to members which have project assignments which match that of the coder. | If non manager, metric shows only reviews associated to the user |