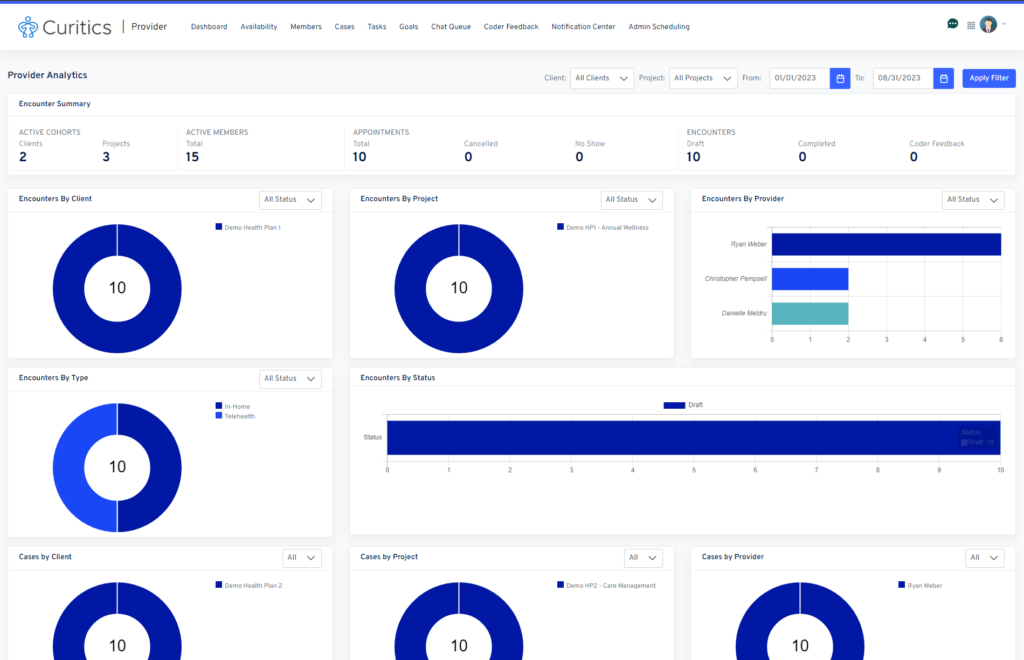
The Provider Module Dashboard is designed to provide a high degree of flexibility with respect to the metrics available for reporting. The purpose of the dashboard is to enable users to generate reports that are useful across a wide range of programs configured within the provider module, each with unique reporting needs.
Filtering and Dynamic User Behavior
The provider dashboard includes three filters
- Filter by client
- Defaulted to all clients
- Filter by project
- Defaulted to all projects
- Filter by data range
- Defaulted to current year through current day
If the user accessing the provider dashboard is a manager (is_manager permission), the user will see data populated for all users of the provider module. If the user is not a manager, data will populate only for themselves.
The dashboard populates data for the clients and projects in which the user has been assigned.
Definitions and Summary of Metrics
| Section | Metric | Definition | Dynamic based upon is_manager permission |
| Encounter Summary | Active Clients | Shows a count of all clients which are active in the Curitics instance in which the user has been assigned | No |
| Encounter Summary | Active Project | Shows a count of all projects which are active in the Curitics instance in which the user has be assigned | No |
| Encounter Summary | Active Members | Shows a count of all members which are active in the Curitics instance in which are assigned to a project which the user is also assigned | No |
| Encounter Summary | Total Appointments | Shows a count of appointments which have been scheduled | If non manager, metric shows only appointments scheduled by the user |
| Encounter Summary | Cancelled Appointments | Shows a count of appointments which have been cancelled | If non manager, metric shows only appointments scheduled by the user |
| Encounter Summary | No Show Appointments | Shows a count of appointments which were marked as no-show | If non manager, metric shows only appointments scheduled by the user |
| Encounter Summary | Draft Encounters | Shows a count of encounters which are in a draft status | If non manager, metric shows only encounters associated to the user |
| Encounter Summary | Completed Encounters | Shows a count of encounters which are in a complete status | If non manager, metric shows only encounters associated to the user |
| Encounter Summary | Coder Feedback | Shows a count of encounters which are in a query status | If non manager, metric shows only encounters associated to the user |
| Encounters by Client | Visualization | Doughnut chart visualization showing a count of encounters by client for clients in which the user is assigned. Visualizing includes a filter enabling the user to choose between one encounter status at a time. Complete status is default option. | If non manager, metric shows only encounters associated to the user |
| Encounters by Project | Visualization | Doughnut chart visualization showing a count of encounters by project for proejcts in which the user is assigned. Visualizing includes a filter enabling the user to choose between one encounter status at a time. Complete status is default option. | If non manager, metric shows only encounters associated to the user |
| Encounters by Provider | Visualization | Bar chart visualizations which shows a count encounters by user which apply to members which have project assignments which match that of the user. Visualizing includes a filter enabling the user to choose between one encounter status at a time. Complete status is default option. | If non manager, metric shows only encounters associated to the user |
| Encounters by Type | Visualization | Doughnut chart visualization showing a count of encounters by associated appointment type which apply to members which have project assignments which match that of the user | If non manager, chart shows only encounters associated to the user |
| Encounters by Status | Visualization | Bar chart visualizations which shows a count encounters by status which apply to members which have project assignments which match that of the user. | If non manager, chart shows only encounters associated to the user |
| Cases by Client | Visualization | Doughnut chart visualization showing a count of cases by client for clients in which the user is assigned. Visualizing includes a filter enabling the user to choose between one cases status at a time or ALL. All is default option. | If non manager, metric shows only cases associated to the user |
| Cases by Project | Visualization | Doughnut chart visualization showing a count of cases by project for projects in which the user is assigned. Visualizing includes a filter enabling the user to choose between one cases status at a time or ALL. All is default option. | If non manager, metric shows only cases associated to the user |
| Cases by Provider | Visualization | Bar chart visualizations which shows a count of cases by user which apply to members which have project assignments which match that of the user. Visualizing includes a filter enabling the user to choose between one cases status at a time or ALL. All is default option. | If non manager, metric shows only cases associated to the user |